
RBI turns hawkish: why the stance matters more than the 25 bps
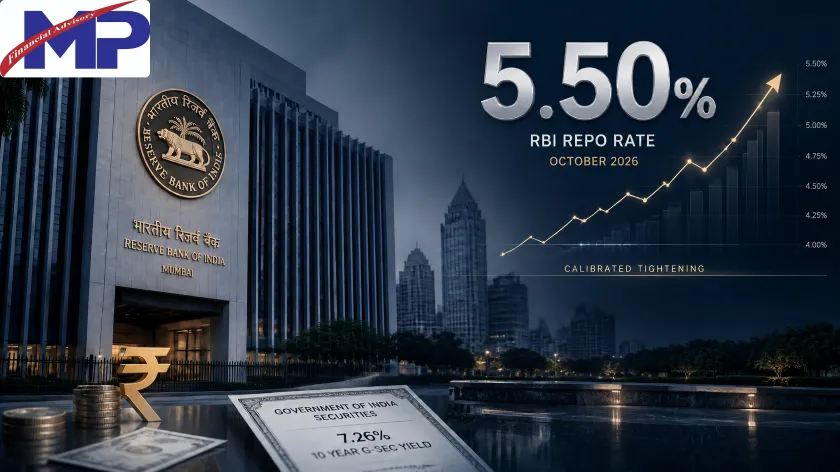
The Reserve Bank of India raised the repo rate by 25 bps to 5.50% on October 7, 2026, its first increase since February 2023. The more important message lies in the stance: the MPC has moved from neutral to calibrated tightening, last adopted in October 2018. That shift rules out easing for now; from here, policy can only hold or tighten. The turn follows an unusually benign 2025, when the repo was cut by 125 bps as CPI inflation averaged just 2.0%. That cushion has gone: CPI is back at 4.82%, wholesale inflation is at 9.92%, and official projections show CPI peaking at 6.0% in Q3 FY27. Meanwhile, the US Fed has resumed hiking, squeezing the India–US rate gap that supports capital flows and the rupee. With growth strong enough to absorb higher rates, we see this as the start of a tightening cycle – one whose length will depend mainly on imported inflation and the Fed.
The decision: the stance matters more than the rate
The 25 bps is modest; the stance change is not. All six MPC members voted for the hike, and the policy corridor shifted up with it: the standing deposit facility (the floor) is now 5.25%, and the marginal standing facility and Bank Rate (the ceiling) are 5.75%. By ruling out near-term cuts and limiting future moves to a hike or a pause, the MPC has signaled a tightening cycle rather than a one-off adjustment. How long it runs will depend on core inflation, how widely price increases spread across the basket, and whether the supply shock feeds into wages and firms' pricing. The bond market read it the same way, with the 10-year G-sec yield rising to 7.25% from 7.19%, apparently on the surprise of the stance shift. The only precedent of calibrated tightening is October 2018, when the MPC held the repo at 6.50% by a 5–1 vote while moving to stance change. It kept that stance in December 2018 before returning to neutral, with a rate cut, in February 2019. This time the hike and the stance change have come together, which makes the signal considerably firmer than in 2018.
The cushion: what the 2025 easing cycle bought
Low inflation gave the RBI room to ease, and the cuts reached borrowers. The repo was cut by a cumulative 125 bps, from 6.50% to 5.25%, between February and December 2025, and held there through the April, June and August 2026 meetings. CPI averaged 2.0% over February–December 2025, touched a low of 0.25% in October 2025, and stayed below the 4% target for 16 consecutive months, from February 2025 to May 2026. Food prices were in outright deflation from June to December 2025, falling 5.02% in October. Transmission was strong: rates on external-benchmark (EBLR) loans fell by the full 125 bps and weighted average lending rates declined 72 bps on fresh loans and 91 bps on outstanding loans. One-year MCLR fell only 39 bps because of its slower reset.
Cheaper money met a strong domestic economy and resilient exports. Two-wheeler retail sales rose 26.9% in Q2 FY27, personal loans grew 16.9% and UPI volumes 22.2%, while consumer durables output increased 11.5% in July–August 2026. GDP growth accelerated from 6.6% in Q4 FY25 to 6.9%, 8.1%, 7.7% and 8.6% over the next four quarters, and was 7.8% in Q1 FY27. Exports held up despite US tariffs of up to 50% from August 2025. They fell 11.8% in October 2025, then recovered after the February 2026 interim trade deal cut the US tariff to 18%. Merchandise exports grew 22.8% to US$88.1 billion in July–August 2026, led by electronics (+71.6%), engineering goods (+21.2%) and petroleum products (+66.0%, helped partly by better margins on oil exports), and services exports rose 13.5%. The hike therefore lands on an economy running hot, not a fragile one, and that strength is what allows the RBI to tighten without undue risk to growth.
Inflation: why the RBI had to turn
Price pressures have broadened, and wholesale prices signal more to come. In August 2026, food inflation rose to 5.95% and fuel inflation to 5.2%. Sugar prices climbed about 34% from early July 2026, and onion prices about 85% between end-June and end-September. Core inflation moved up to 4.2% after holding at 3.9% for three months, although excluding precious metals it was only 2.9%, so higher gold and silver prices explain much of the rise. Elevated gold prices also matter beyond CPI: they inflate India's import bill, which widens the trade deficit and adds to pressure on the rupee.
The clearer evidence of broadening is that roughly 37% of the CPI basket by weight now carries inflation above 4%. The larger warning is in wholesale prices: WPI inflation jumped from 1.19% in January 2026 to 9.92% in August, roughly twice the pace of consumer prices. So far, producers appear to be absorbing most of these higher input costs rather than passing them on to consumers. Should that change, retail inflation could overshoot the current projections.
Supply-side risks are unlikely to fade soon. The southwest monsoon finished about 13% short of normal, El Niño conditions are strong, and the Indian crude basket rose from US$82.0 a barrel in July 2026 to US$116.1 in September. CPI is now projected at 5.2% for FY27 (4.9% in Q2, 6.0% in Q3 and 5.7% in Q4) and 5.6% for Q1 FY28, with core inflation at 4.4%. The real policy rate shows the urgency. In December 2025 the 5.25% repo was 3.9 percentage points above CPI of 1.33%. Today the 5.50% repo is only 0.7 points above CPI of 4.82%, and against the Q3 projection of 6.0% the real rate turns negative.
Growth and credit: strong enough to absorb a hike
Growth forecasts have moved up, not down, and Q2 momentum is holding. The FY27 GDP forecast has been raised by 40 bps to 7.1%, with growth moderating from 7.8% in Q1 FY27 to 7.2% in Q2, 6.9% in Q3 and 6.8% in Q4; Q1 FY28 is projected at 7.1%. The 7.8% growth in Q1 FY27 came mainly from household spending and investment, with a positive contribution from net exports. Q2 indicators point to sustained, if slightly slower, momentum. Manufacturing output grew 8.6% and capital goods output 17.9% in July–August 2026. The manufacturing PMI averaged 53.8 in Q2 against 54.6 in Q1, while the services PMI eased more sharply, to 54.2 from 58.7. There are soft patches, though: output of consumer non-durables grew only 0.6%, and domestic air traffic fell 5.4%.
Credit growth is a key demand-side risk, though lenders are well placed. Bank credit grew 18.1% year-on-year as of September 15, 2026, compared with 10.4% a year earlier. We see growth at this pace as an inflation risk, even though evidence of demand-side pressure remains limited. The expansion is broad-based: industrial credit growth has more than doubled, led by large industries and buoyant MSME lending, alongside strong flows to services (including NBFCs, where bank credit grew about 37%), retail and agriculture. Lender balance sheets remain healthy: banks' gross NPA ratio was 1.67% and capital adequacy 17.87% in June 2026, while NBFCs reported gross NPA of 2.50% and capital adequacy of 25.50%.
Markets: real tightening exceeds 25 bps, and the US rate gap is narrowing
Longer-term rates had tightened before the hike, and the short end will now follow. Surplus liquidity, averaging ₹5.9 lakh crore since the August policy, has kept the overnight call rate about 14 bps below the repo. With the central bank now committed to bringing the call rate back in line with the repo, overnight rates could rise by roughly 40 bps in all, well above the headline 25 bps. Short-term money, by contrast, has eased on the back of that liquidity: 3-month CDs averaged 6.33% and 3-month CPs 6.91% since the August policy, down from about 6.7% and 7.5% between the April and June policies. Longer tenors tell a different story. The 12-month CD rate has also eased, from nearly 7.9% to around 7.5%, but it still sits about 115–120 bps above the 3-month rate. That steep curve suggests lenders are pricing in further policy tightening and demanding a higher premium to lock in funds for longer, even as they remain comfortable with near-term liquidity. Long-term yields had also moved ahead of the policy, rising from mid-August as tensions in West Asia flared again, global yields climbed and crude prices increased. The 10-year G-sec touched a two-year high of 7.21% on 1 October and closed policy day at 7.25%. Lending rates had begun to rise even with the repo on hold: the median one-year MCLR increased 21 bps in H1 FY27, and rates on fresh loans rose 8 bps in July–August.
The narrowing gap with US rates is the new constraint. The US Fed raised rates by 25 bps to 3.75–4.00% in September 2026 by a 12–0 vote, its first hike since 2023. Futures markets price the fed funds rate at about 4.1% by January 2027 and 4.8% by October 2027. The US 10-year yield touched 5.10% in September, its highest since July 2007, leaving India's 10-year yield about 215 bps above it. A narrower gap makes Indian assets less attractive to foreign investors. Net FPI outflows totalled US$10.3 billion from April to 5 October 2026, and foreign investors have sold about ₹2.45 lakh crore of Indian equities in calendar 2026, more than in the whole of 2025. Each further Fed hike will add to the pressure on the RBI to respond.
External sector: comfortable buffers, rising pressure
The current account is under strain but still manageable. The deficit was 0.5% of GDP (US$4.2 billion) in Q1 FY27, but the merchandise trade deficit widened to US$58.7 billion in July–August 2026 from US$55.1 billion a year earlier, as imports of electronics and crude rose. For FY27, the deficit is projected at 1.2% of GDP. A services surplus of US$85.8 billion (April–August) and remittances of US$53.9 billion (April–July) continue to provide an offset, and the new bilateral trade agreements, including the one with the UK, should help exports.
Capital flows are mixed, but buffers remain strong. Net FDI improved to US$13.8 billion in April–August 2026 from US$9.6 billion a year earlier. Portfolio money has been leaving, but non-resident deposits brought in US$119.2 billion in April–August, against US$5.6 billion a year earlier, driven by an RBI swap window for FCNR(B) deposits – open from June to August 2026, it covered banks' hedging cost on fresh 3–5 year deposits, so much of this money could flow out as the deposits mature. Together, these flows underpin a projected balance of payments surplus of about US$90 billion for FY27, but that comfort rests on policy-induced deposits rather than organic inflows. Forex reserves stood at US$734.6 billion on 2 October 2026, enough to cover about 11 months of imports and 94.4% of external debt. The rupee traded between ₹92 and ₹97 per dollar in April–September 2026, depreciating 1.4% in H1 FY27 after a sharper 6.2% fall in H2 FY26.
Looking ahead: what decides the length of this cycle
The length of this cycle will depend on incoming data, and most of the data that matters will come from outside India. Crude oil and the West Asia conflict are the single biggest risk. WTI began 2026 near US$57 a barrel, peaked at US$113 in April and is back above US$100. The Indian crude basket averaged US$116.1 in September, well above the US$95 (Brent) assumed in the official projections for H2 FY27. Disruption around the Strait of Hormuz would push up inflation, the trade deficit and the fiscal cost of fuel-tax relief all at once, while a durable ceasefire would provide much-needed comfort.
The Fed, the rupee and trade policy will shape the rest of the outlook. The next FOMC meeting is on 27–28 October, and every Fed hike the RBI does not match narrows the rate gap further and adds to portfolio outflows. A weaker rupee feeds imported inflation and raises the cost of foreign-currency debt, which matters for corporates with unhedged ECBs: gross ECB disbursements rose to US$23.9 billion in April–August 2026. On trade, the interim deal's 18% tariff is a tailwind, and exports to the US rose 21.8% in August. It remains a framework, though, and any reversal would hit textiles, gems and jewellery, and engineering goods first. Among secondary risks, cheap Chinese exports raise dumping risk for Indian steel, chemicals and solar makers.
Conclusion: has the cycle begun?
We believe it has; barring a sharp turn in the external environment, this is the start of a tightening cycle, not a single insurance hike. Conflict in West Asia, tariff uncertainty, elevated bond yields and the risk of a sharp correction in AI-linked stocks have made investors wary of emerging markets. India enters this phase from strength, but policy priority has clearly shifted to price and financial stability. With CPI projected at 6.0% in Q3 FY27, the real repo rate turns negative, and professional forecasters already expect the repo at 5.75% by March 2027. How long the cycle lasts will depend mainly on crude prices and the Fed.
For borrowers, the implications are direct:
- Floating-rate borrowers: EBLR loans will reflect the 25 bps at the next reset; MCLR-linked loans, still common at public sector banks, will follow with a lag.
- NBFCs and CP-dependent corporates: they face the earliest pressure, as 3-month CP rates, now near 6.9%, rise with overnight rates moving towards the repo. For NBFCs, higher funding costs will squeeze net interest margins unless passed on to borrowers.
- Leveraged mid-sized companies: interest coverage and DSCR will weaken, and margins are exposed, as wholesale inflation at 9.9% against CPI at 4.8% means input costs are rising faster than selling prices.
- Exporters and foreign-currency borrowers: exporters to the US are better placed than a year ago, while companies with unhedged foreign-currency debt carry the most rupee risk.
Sources:
- RBI, Governor's Statement, 7 October 2026 (Press Release 2026-2027/1266)
- RBI, Monetary Policy Report, October 2026 (Table II.7, Table V.2, Table V.3)
- RBI, Sectoral Deployment of Bank Credit – August 2026
- https://www.mospi.gov.in/themes/product/9-consumer-price-index-cpi
- https://eaindustry.nic.in/press_release/press_release_202608.pdf
- https://www.mospi.gov.in/themes/product/6-gross-domestic-product
- https://www.business-standard.com/amp/finance/news/india-bond-yield-rbi-mpc-repo-rate-calibrated-tightening-126100700323_1.html
- https://www.business-standard.com/amp/article/finance/monetary-policy-rbi-keeps-repo-rate-unchanged-at-6-50-rupee-plunges-top-highlights-118100500496_1.html
- https://www.schwab.com/learn/story/fomc-meeting
- https://streetstats.finance/rates/fedfunds
- https://www.cnbc.com/2026/09/23/treasury-yields-oil-inflation-fed.html
- https://tradingeconomics.com/india/exports/news/502580
- https://www.india-briefing.com/news/india-us-trade-deal-tariff-cut-export-investment-outlook-2026-2-42367.html/
MPFASL Analytical Contacts
Mr. Mahendra Patil Managing Partner mahendra.patil@mpfasl.com
About MPFASL
MP Financial Advisory Services LLP is a financial consultancy firm providing Credit Risk Advisory, Debt Syndication, Private Credit Assessment, and Financial Strength Assessment services to corporates across India. Since 2013, we have provided Credit Risk consultancy services to over 350 corporate clients spanning over 25 industry verticals. Having completed over 500 credit risk advisory assignments with a cumulative debt volume of over Rs. 3.00 Lakh Crore, MPFASL boasts of a 95+% success ratio in obtaining deserving credit ratings for its clients.
Before venturing into entrepreneurship, Mr. Mahendra Patil was part of CARE Ratings during 2006 – 2013 where he looked after credit rating assignments of more than 500 companies ranging from various sectors. Additionally, he was part of the Internal Credit Rating Committee at CARE Ratings.
Mahendra Patil
Founder & Managing Partner
MP Financial Advisory Services LLP
801, Swastik Chamber, 3rd Floor, C. S. T. Road, Chembur, East, Mumbai – 400 071
Tel: +91 99201 45989 | E: mahendra.patil@mpfasl.com | w: www.mpfasl.com
Disclaimer: The report/information/opinion contains confidential, proprietary or legally privileged information and is intended solely for the use of the individual or entity to whom it is addressed. The report/information/opinion (or any part of it) should not be circulated/ used/ published/ reproduced in any form without prior approval/ consent from MP Financial Advisory Services LLP (MPFASL). MPFASL’s publications/reports/opinions are based on information obtained from sources considered reliable by it. MPFASL has not conducted any audit of the information provided. While reasonable care has been taken to ensure that the information herein is true, such information is provided ‘as is’ without any warranty of any kind, and MPFASL in particular, makes no representation or warranty, express or implied, as to the accuracy, timeliness or completeness of any such information. Hence, MPFASL will not be liable, in any manner including financial, for any inaccuracy of such information and/or reports or solutions provided by MPFASL. MPFASL has no financial liability towards the users/distributors/subscribers of its articles/reports.